Robert Gitari

Passionate about using data to drive decision making
Masters in Business Analytics at Duke University: Fuqua School of Business
View My LinkedIn Profile
Bank Marketing: “To ring or Fling?”
Project description: I have developed several models which predict which customers are more likely to open a term deposit after being contacted by the bank’s marketing team. for a listing given the characteristics of the property. The models range from those based on supervised learning (such as Logistic regression and random forest), and models based on unsupervised learning (such as Principal Component Analysis and k-means) as well as using regularization techniques with Lasso.
Business use cases: In this project we observe a Portuguese bank which had started a marketing campaign to increase their term deposits. The marketing team reached out to potential customers to attract new term deposits but unfortunately, this approach has not been very successful over the past few months. To address this performance issue, I performed predictive analysis to identify the customers who have the highest chance of subscribing to the bank’s term deposits after being contacted by the marketing team.
1. The fundamental problem of having an unbalanced target variable
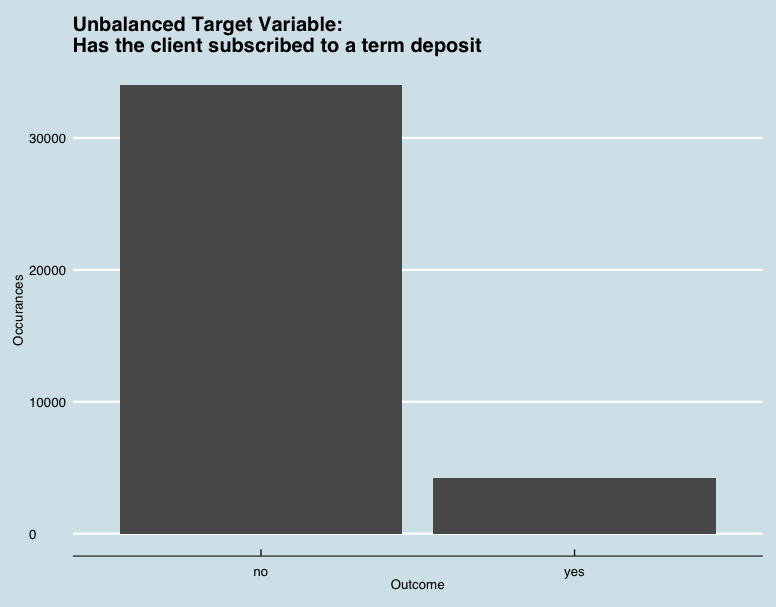
The dataset is unbalanced, and so many of our algorithms I use perform poorly in this scenario (i.e. predicts well only for the majority class).To bypass this restriction they are several options, I decided to use a synthetic minority oversampling technique (SMOTE) from the smotefamily package. It uses k nearest neighbors to find the n-nearest neighbors in the minority class for each of the samples in the class to generate new and synthetic data we can use for training our model. This induces bias in our model but we will compare its performance with the models with unbalanced data.
2. Data leakage
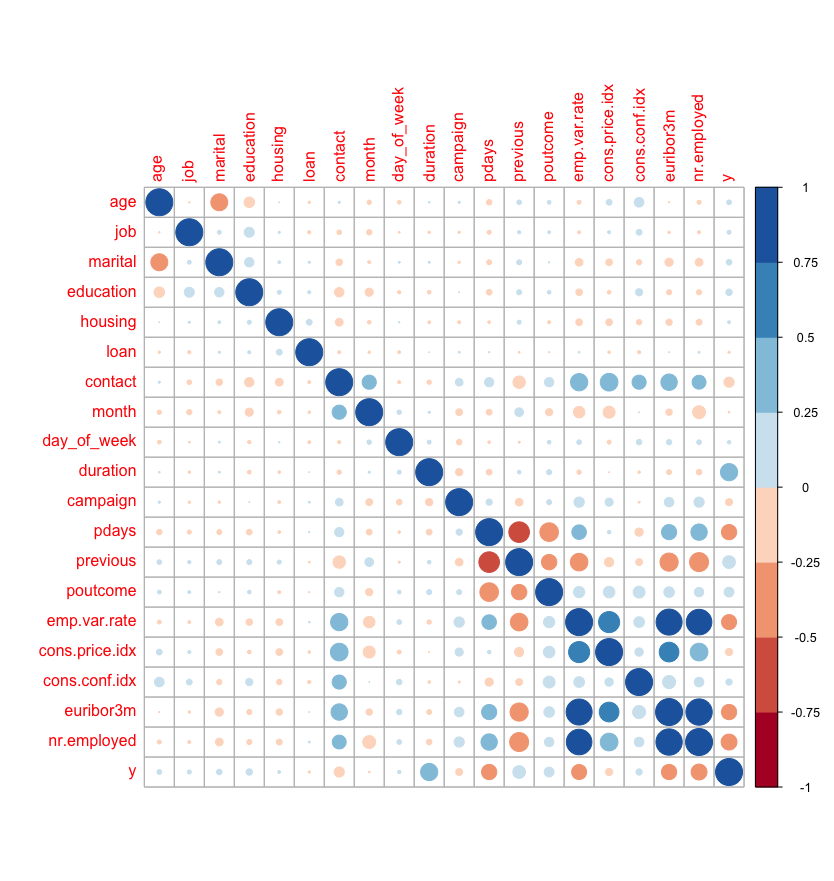
- Call duration is most positivley correlated with our target variable of interest (y).
- But call duration is not know prior to making a call and thus cannot be used in predictive modelling.
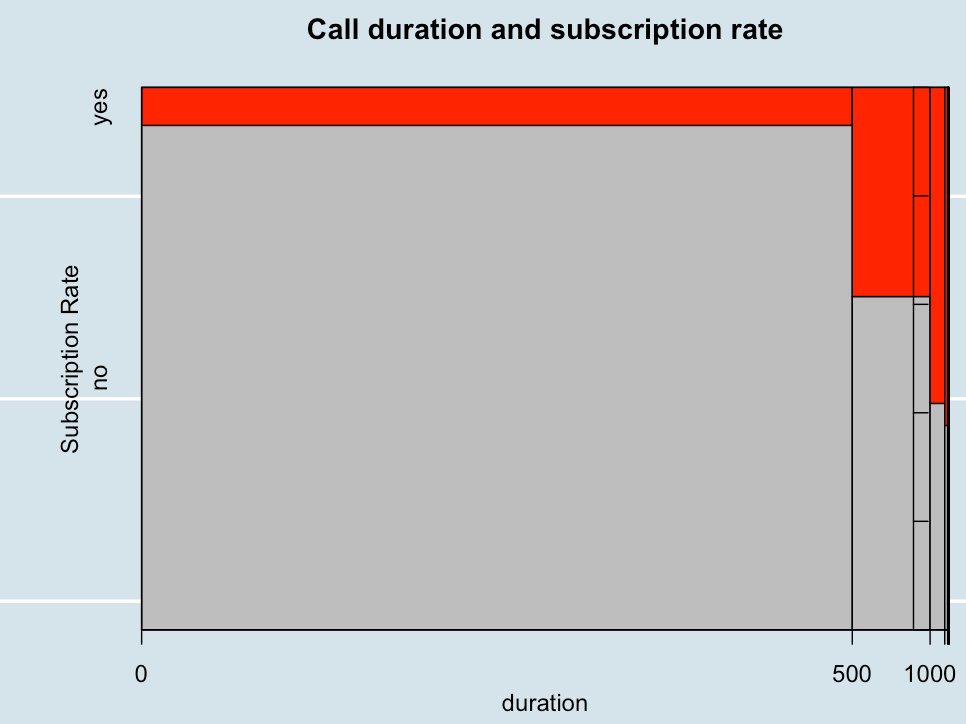
Relationship of Call duration and subscription rate.
We can see as the call duration increases the subscription rate increases.
3. Unsupervised Learning
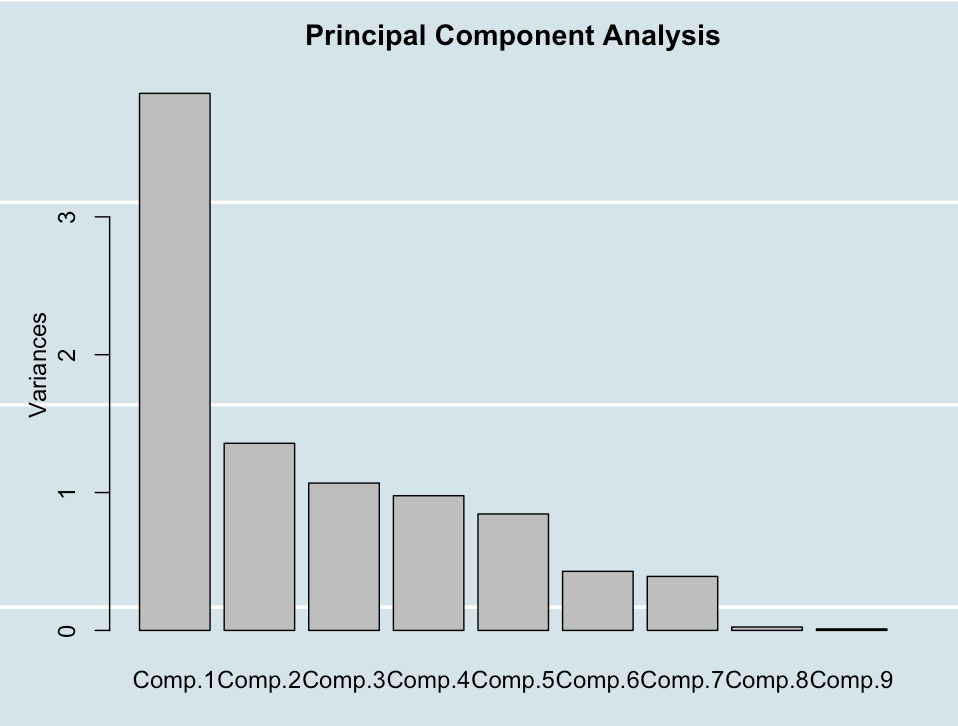
I ran Principal component analysis(PCA) to reduce the number of dimensions which explain the common variance of features. From the graph above, I find that the first 4 principal components explain roughly 30% of the variance, while the first 9 PCs explain 50% of the variance. Given that it takes 9 principal components to explain 50% of the variance, this is not very efficient in dimension reduction. A potential reason for this inefficiency is that most of the features in the dataset do not have high correlation, making it hard for us to group features into fewer dimensions.
4. Final Model Performance
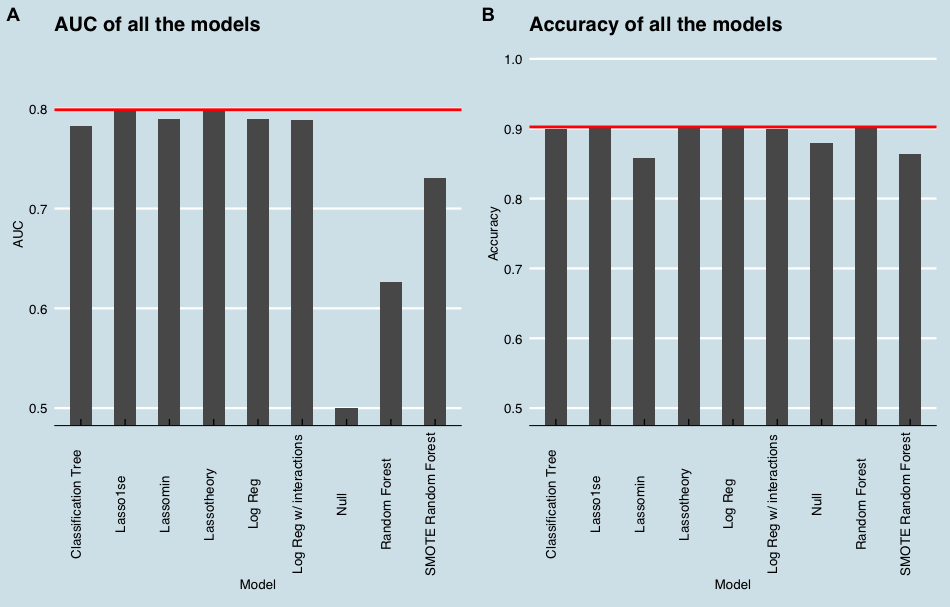
Final Model Selected is the Lasso Model based on theory.
It has the highest Accuracy rate (90.25%) and AUC (79.9%) among all the models.
Which indicates that it has the best OOS performance.
Summary
By using data-driven models as described above, this will allow the bank to target customers that are likely to be affected by the marketing campaign, instead of wasting the resources to randomly selecting customers. This will increase the efficiency of their campaigns.
According to the final model, the bank should target customers with specific demographics such as retired people and people with university degrees, and avoid certain times of the year, especially in the month of May.
For more details see GitHub Flavored Markdown.